So the expression becomes \(\dfrac{2+4\sqrt{3}}{\sqrt{22}}\).
Rationalise the denominator by multiplying top and bottom by \(\sqrt{22}\): \(\dfrac{(2+4\sqrt{3})\sqrt{22}}{22} = \dfrac{2\sqrt{22}+4\sqrt{66}}{22}\).
Divide numerator and denominator by the common factor \(2\): \(\dfrac{\sqrt{22}+2\sqrt{66}}{11}\).
Answer: \(\dfrac{\sqrt{22}+2\sqrt{66}}{11}\)
2.3 marks(a)
Rationalise the denominator of \(\frac{1}{\sqrt{3}}\)
(b)
Expand \((2+\sqrt{3})(1+\sqrt{3})\)
Give your answer in the form \(a+b\sqrt{3}\) where \(a\) and \(b\) are integers.
Worked solution
(a)
Multiply numerator and denominator by \(\sqrt{3}\) to remove the surd from the denominator: \(\dfrac{1}{\sqrt{3}} \times \dfrac{\sqrt{3}}{\sqrt{3}} = \dfrac{\sqrt{3}}{3}\).
Rationalise the denominator of \(\frac{1}{\sqrt{7}}\)
(b) (i)
Expand and simplify \((\sqrt{3}+\sqrt{15})^{2}\)
Give your answer in the form \(a+b\sqrt{3}\) where \(a\) and \(b\) are integers.
(ii)
All measurements on the triangle are in centimetres. ABC is a right-angled triangle. \(k\) is a positive integer.
Find the value of \(k\).
Worked solution
(a)
Multiply numerator and denominator by \(\sqrt{7}\): \(\dfrac{1}{\sqrt{7}} \times \dfrac{\sqrt{7}}{\sqrt{7}} = \dfrac{\sqrt{7}}{7}\).
Answer: \(\dfrac{\sqrt{7}}{7}\)
(b)(i)
Note: the question states the answer should be in the form \(a+b\sqrt{3}\), but this is a source typo — the correct form is \(a+b\sqrt{5}\). The mathematically correct expansion is given below.
Use \((x+y)^2 = x^2 + 2xy + y^2\) with \(x=\sqrt{3}\) and \(y=\sqrt{15}\): \((\sqrt{3}+\sqrt{15})^2 = (\sqrt{3})^2 + 2\sqrt{3}\cdot\sqrt{15} + (\sqrt{15})^2\).
Simplify the squares: \((\sqrt{3})^2 = 3\) and \((\sqrt{15})^2 = 15\).
Write \(\sqrt{45}\) in the form \(k\sqrt{5}\), where \(k\) is an integer.
Worked solution
(a)
Recall that \(x^{\frac{1}{2}} = \sqrt{x}\). So \(49^{\frac{1}{2}} = \sqrt{49} = 7\).
Answer: \(7\)
(b)
Find a factor of \(45\) that is a perfect square: \(45 = 9 \times 5\).
Use \(\sqrt{ab} = \sqrt{a}\sqrt{b}\): \(\sqrt{45} = \sqrt{9}\cdot\sqrt{5} = 3\sqrt{5}\).
So \(k = 3\).
Answer: \(3\sqrt{5}\)
6.2 marks
Write \(\frac{\sqrt{18}+10}{\sqrt{2}}\) in the form \(a+b\sqrt{2}\) where \(a\) and \(b\) are integers.
Worked solution
Split the fraction: \(\dfrac{\sqrt{18}+10}{\sqrt{2}} = \dfrac{\sqrt{18}}{\sqrt{2}} + \dfrac{10}{\sqrt{2}}\).
Simplify the first term using \(\dfrac{\sqrt{a}}{\sqrt{b}} = \sqrt{\dfrac{a}{b}}\): \(\dfrac{\sqrt{18}}{\sqrt{2}} = \sqrt{\dfrac{18}{2}} = \sqrt{9} = 3\).
Rationalise the second term: \(\dfrac{10}{\sqrt{2}} \times \dfrac{\sqrt{2}}{\sqrt{2}} = \dfrac{10\sqrt{2}}{2} = 5\sqrt{2}\).
Add the results: \(3 + 5\sqrt{2}\).
So \(a = 3\) and \(b = 5\).
Answer: \(3 + 5\sqrt{2}\)
7.3 marks
Expand and simplify \((2+\sqrt{3})(7-\sqrt{3})\)
Give your answer in the form \(a+b\sqrt{3}\) where \(a\) and \(b\) are integers.
Rationalise the denominator of \(\frac{(4+\sqrt{2})(4-\sqrt{2})}{\sqrt{7}}\)
Give your answer in its simplest form.
Worked solution
Expand the numerator using the difference of two squares \((x+y)(x-y) = x^2 - y^2\): \((4+\sqrt{2})(4-\sqrt{2}) = 4^2 - (\sqrt{2})^2 = 16 - 2 = 14\).
So the expression is \(\dfrac{14}{\sqrt{7}}\).
Rationalise the denominator by multiplying top and bottom by \(\sqrt{7}\): \(\dfrac{14}{\sqrt{7}} \times \dfrac{\sqrt{7}}{\sqrt{7}} = \dfrac{14\sqrt{7}}{7}\).
Simplify: \(\dfrac{14\sqrt{7}}{7} = 2\sqrt{7}\).
Answer: \(2\sqrt{7}\)
9.2 marks
Show that \(\frac{(4-\sqrt{3})(4+\sqrt{3})}{\sqrt{13}}\) simplifies to \(\sqrt{13}\)
Worked solution
Expand the numerator using the difference of two squares \((x-y)(x+y) = x^2 - y^2\): \((4-\sqrt{3})(4+\sqrt{3}) = 4^2 - (\sqrt{3})^2 = 16 - 3 = 13\).
So the expression becomes \(\dfrac{13}{\sqrt{13}}\).
Rationalise by multiplying top and bottom by \(\sqrt{13}\): \(\dfrac{13}{\sqrt{13}} \times \dfrac{\sqrt{13}}{\sqrt{13}} = \dfrac{13\sqrt{13}}{13}\).
Cancel the \(13\): \(= \sqrt{13}\), as required.
Bounds Calculations
8 questions
Things to remember
Calculating bounds is the opposite of rounding – they are the limits at which you would round up instead of down, and vice versa.
When dividing bounds: UB = UB ÷ LB and LB = LB ÷ UB
1.2 marks
A piece of wood has a length of 65 centimetres to the nearest centimetre.
(a)
What is the least possible length of the piece of wood?
(b)
What is the greatest possible length of the piece of wood?
Worked solution
(a)
The length is 65 cm to the nearest centimetre, so the degree of accuracy is 1 cm.
Lower bound = 65 - 0.5 = 64.5 cm.
Answer: 64.5 cm
(b)
Upper bound = 65 + 0.5 = 65.5 cm.
The greatest possible length is just below 65.5 cm (strict upper bound).
Answer: 65.5 cm
2.2 marks
Chelsea's height is 168 cm to the nearest cm.
(a)
What is Chelsea's minimum possible height?
(b)
What is Chelsea's maximum possible height?
Worked solution
(a)
Chelsea's height is 168 cm to the nearest cm, so the degree of accuracy is 1 cm.
Minimum possible height = 168 - 0.5 = 167.5 cm.
Answer: 167.5 cm
(b)
Maximum possible height = 168 + 0.5 = 168.5 cm.
The maximum possible height is just below 168.5 cm (strict upper bound).
Answer: 168.5 cm
3.3 marks
\[I = \frac{V}{R}\]
\(V = 250\) correct to the nearest 5
\(R = 3900\) correct to the nearest 100
Work out the lower bound for the value of \(I\).
Give your answer correct to 3 decimal places.
You must show your working.
Worked solution
\(V = 250\) correct to the nearest 5, so LB of \(V = 250 - 2.5 = 247.5\) and UB of \(V = 250 + 2.5 = 252.5\).
\(R = 3900\) correct to the nearest 100, so LB of \(R = 3900 - 50 = 3850\) and UB of \(R = 3900 + 50 = 3950\).
Since \(I = \dfrac{V}{R}\), the lower bound of \(I\) is obtained by dividing the LB of \(V\) by the UB of \(R\): \(\text{LB of } I = \dfrac{247.5}{3950}\).
\(\dfrac{247.5}{3950} = 0.0626582...\)
Correct to 3 decimal places: \(0.063\).
Answer: 0.063
4.5 marks
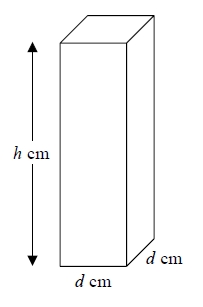
Here is a solid bar made of metal. The bar is in the shape of a cuboid. The height of the bar is \(h\) cm. The base of the bar is a square of side \(d\) cm. The mass of the bar is \(M\) kg.
\(d = 8.3\) correct to 1 decimal place.
\(M = 13.91\) correct to 2 decimal places.
\(h = 84\) correct to the nearest whole number.
Find the value of the density of the metal to an appropriate degree of accuracy.
Give your answer in g/cm\(^3\).
You must explain why your answer is to an appropriate degree of accuracy.
Worked solution
\(d = 8.3\) correct to 1 decimal place: LB of \(d = 8.25\), UB of \(d = 8.35\).
\(M = 13.91\) correct to 2 decimal places: LB of \(M = 13.905\) kg, UB of \(M = 13.915\) kg.
\(h = 84\) correct to the nearest whole number: LB of \(h = 83.5\), UB of \(h = 84.5\).
Volume of the cuboid \(= d^2 \times h\).
Density \(= \dfrac{\text{mass}}{\text{volume}} = \dfrac{M}{d^2 \times h}\). Convert mass to grams: \(M\) kg \(= 1000M\) g.
Upper bound of density: use UB of \(M\), LB of \(d\), and LB of \(h\): \(\dfrac{1000 \times 13.915}{8.25^2 \times 83.5} = \dfrac{13915}{5682.09375} = 2.4489...\) g/cm\(^3\).
Lower bound of density: use LB of \(M\), UB of \(d\), and UB of \(h\): \(\dfrac{1000 \times 13.905}{8.35^2 \times 84.5} = \dfrac{13905}{5893.16125} = 2.3594...\) g/cm\(^3\).
Upper bound \(\approx 2.449\) and lower bound \(\approx 2.359\). Both round to 2.4 when rounded to 2 significant figures.
Since both bounds round to the same value at 2 significant figures, the density is 2.4 g/cm\(^3\) to an appropriate degree of accuracy.
Answer: 2.4 g/cm\(^3\)
5.4 marks
Steve travelled from Ashton to Barnfield.
He travelled 235 miles, correct to the nearest 5 miles.
The journey took him 200 minutes, correct to the nearest 5 minutes.
Calculate the lower bound for the average speed of the journey.
Give your answer in miles per hour, correct to 3 significant figures.
You must show all your working.
Worked solution
Distance = 235 miles correct to the nearest 5 miles: LB = 235 - 2.5 = 232.5 miles, UB = 235 + 2.5 = 237.5 miles.
Time = 200 minutes correct to the nearest 5 minutes: LB = 200 - 2.5 = 197.5 minutes, UB = 200 + 2.5 = 202.5 minutes.
Lower bound of speed = \(\dfrac{\text{LB of distance}}{\text{UB of time}}\).
Lower bound of speed = \(\dfrac{232.5}{202.5}\) miles per minute.
Convert to miles per hour by multiplying by 60: \(\dfrac{232.5}{202.5} \times 60 = \dfrac{13950}{202.5} = 68.888...\) mph.
Correct to 3 significant figures: 68.9 mph.
Answer: 68.9 mph
6.4 marks
The value of \(p\) is 4.3
The value of \(q\) is 0.4
Both \(p\) and \(q\) are given correct to the nearest 0.1
(a)
Write down the lower bound for \(p\).
(b)
Work out the upper bound for \(r\).
\[r = p + \frac{1}{q}\]
You must show all your working.
Worked solution
(a)
\(p = 4.3\) correct to the nearest 0.1, so the degree of accuracy is 0.1.
Lower bound of \(p = 4.3 - 0.05 = 4.25\).
Answer: 4.25
(b)
\(r = p + \dfrac{1}{q}\). To maximise \(r\), maximise \(p\) and maximise \(\dfrac{1}{q}\).
UB of \(p = 4.3 + 0.05 = 4.35\).
\(q = 0.4\) correct to the nearest 0.1: LB of \(q = 0.4 - 0.05 = 0.35\).
To maximise \(\dfrac{1}{q}\), use the LB of \(q\) (dividing by a smaller positive number gives a larger result).
UB of \(\dfrac{1}{q} = \dfrac{1}{0.35} = 2.\overline{857142}\)
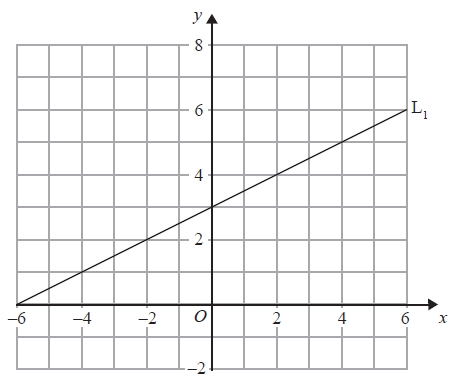
Find an equation of the straight line perpendicular to L which passes through \((-2, 3)\).
Worked solution
The line \(L\) has equation \(y = 2x - 5\), so its gradient is \(2\).
For a perpendicular line, \(m_1 \times m_2 = -1\), so \(m_2 = \dfrac{-1}{2}\).
Substitute the point \((-2, 3)\) into \(y = -\dfrac{1}{2}x + c\): \(3 = -\dfrac{1}{2}(-2) + c\).
Simplify: \(3 = 1 + c\), so \(c = 2\).
The equation of the perpendicular line is \(y = -\dfrac{1}{2}x + 2\).
Answer: \(y = -\dfrac{1}{2}x + 2\)
3.5 marks
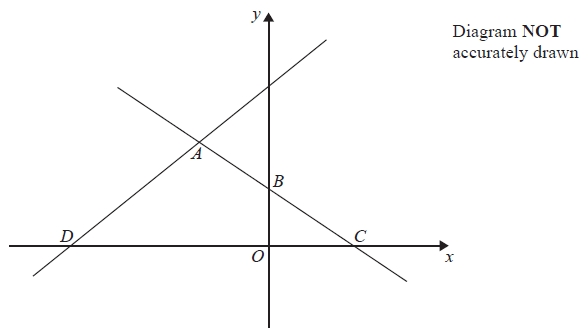
In the diagram, ABC is the line with equation \(y = -\frac{1}{2}x + 5\)
\(AB = BC\)
\(D\) is the point with coordinates \((-13, 0)\)
Find an equation of the line through \(A\) and \(D\).
Worked solution
Line \(ABC\) has equation \(y = -\dfrac{1}{2}x + 5\).
Find where the line crosses the axes. When \(x = 0\): \(y = 5\), giving point \(B = (0, 5)\). When \(y = 0\): \(0 = -\dfrac{1}{2}x + 5\), so \(x = 10\), giving point \(C = (10, 0)\).
Since \(AB = BC\) and \(B\) lies between \(A\) and \(C\) on the line, \(B\) is the midpoint of \(AC\).
Using the midpoint formula: if \(A = (a, b)\), then \(\dfrac{a + 10}{2} = 0\) and \(\dfrac{b + 0}{2} = 5\). So \(a = -10\) and \(b = 10\), giving \(A = (-10, 10)\).
Find the gradient of line \(AD\) where \(D = (-13, 0)\): \(m = \dfrac{10 - 0}{-10 - (-13)} = \dfrac{10}{3}\).
Using point \(D(-13, 0)\): \(y - 0 = \dfrac{10}{3}(x + 13)\), so \(y = \dfrac{10}{3}x + \dfrac{130}{3}\).
Answer: \(y = \dfrac{10}{3}x + \dfrac{130}{3}\)
4.3 marks
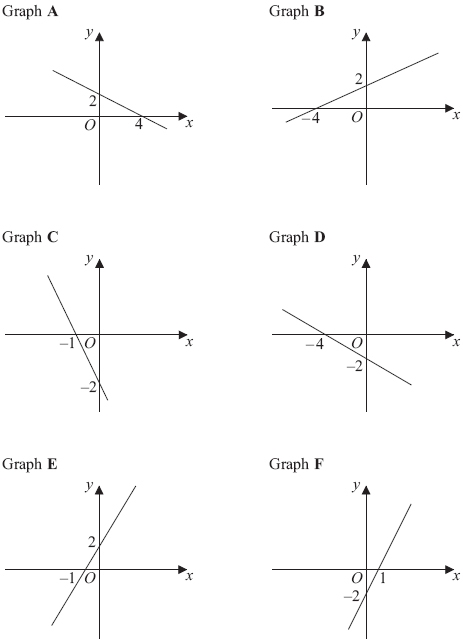
Here are the graphs of 6 straight lines.
Match each of the graphs A, B, C, D, E and F to the equations in the table.
Equation
\(y = \frac{1}{2}x + 2\)
\(y = 2x - 2\)
\(y = -\frac{1}{2}x + 2\)
\(y = -2x - 2\)
\(y = 2x + 2\)
\(y = -\frac{1}{2}x - 2\)
Graph
Worked solution
Identify each graph by its gradient (positive/negative, steep/gentle) and y-intercept (positive/negative).
The equation is \(y = -\dfrac{1}{2}x + \dfrac{3}{2}\).
Answer: \(y = -\dfrac{1}{2}x + \dfrac{3}{2}\)
6.4 marks
Find an equation of the straight line that is perpendicular to the straight line \(x + 2y = 5\) and that passes through the point \((3, 7)\).
Worked solution
Rearrange \(x + 2y = 5\) into the form \(y = mx + c\): \(2y = -x + 5\), so \(y = -\dfrac{1}{2}x + \dfrac{5}{2}\).
The gradient of this line is \(-\dfrac{1}{2}\).
The perpendicular gradient is \(m = 2\) (since \(-\dfrac{1}{2} \times 2 = -1\)).
Substitute the point \((3, 7)\) into \(y = 2x + c\): \(7 = 2(3) + c\), so \(7 = 6 + c\), giving \(c = 1\).
The equation is \(y = 2x + 1\).
Answer: \(y = 2x + 1\)
7.3 marks
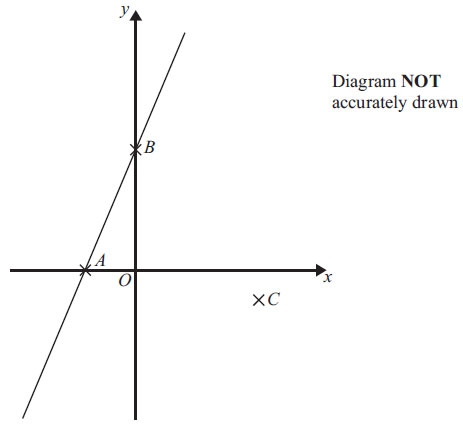
*7. \(A\) and \(B\) are straight lines.
Line \(A\) has equation \(2y = 3x + 6\)
Line \(B\) goes through the points \((-1, 2)\) and \((2, 8)\)
Do lines \(A\) and \(B\) intersect?
You must show all your working.
Worked solution
Rearrange Line \(A\): \(2y = 3x + 6\), so \(y = \dfrac{3}{2}x + 3\). The gradient of Line A is \(\dfrac{3}{2}\).
Find the gradient of Line \(B\) through \((-1, 2)\) and \((2, 8)\): \(m = \dfrac{8 - 2}{2 - (-1)} = \dfrac{6}{3} = 2\).
Since the gradients are different (\(\dfrac{3}{2} \neq 2\)), the lines are not parallel.
Non-parallel straight lines always intersect, so yes, lines A and B do intersect.
Answer: Yes, lines A and B intersect because they have different gradients (\(\dfrac{3}{2}\) and \(2\)), so they are not parallel.
8.3 marks
A straight line, \(L\), is perpendicular to the line with equation \(y = 1 - 3x\).
The point with coordinates \((6, 3)\) is on the line \(L\).
Find an equation of the line \(L\).
Worked solution
The given line has equation \(y = 1 - 3x\), which can be written as \(y = -3x + 1\). Its gradient is \(-3\).
The perpendicular gradient is \(m = \dfrac{1}{3}\) (since \(-3 \times \dfrac{1}{3} = -1\)).
Substitute the point \((6, 3)\) into \(y = \dfrac{1}{3}x + c\): \(3 = \dfrac{1}{3}(6) + c\), so \(3 = 2 + c\), giving \(c = 1\).
The equation of line \(L\) is \(y = \dfrac{1}{3}x + 1\).
Answer: \(y = \dfrac{1}{3}x + 1\)
Transformations of graphs
4 questions
Things to remember
f(x) means the function of x.
-f(x) is a reflection in the x-axis.
f(-x) is a reflection in the y-axis.
f(x − a) is a translation in the x-axis, a units.
f(x) + b is a translation in the y-axis, b units.
cf(x) is an enlargement in the y-axis, scale factor c.
f(dx) is an enlargement in the x-axis, scale factor 1/d.
1.3 marks
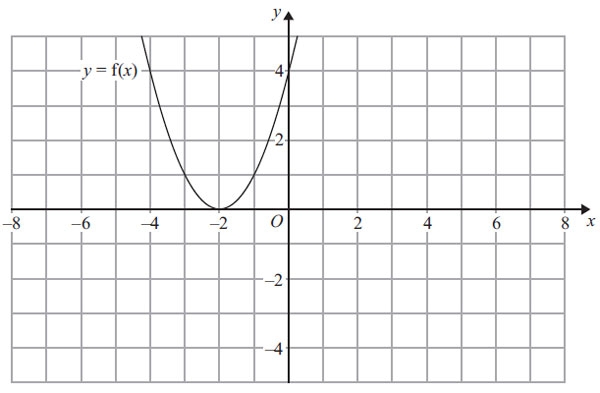
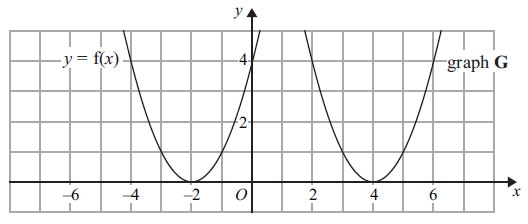
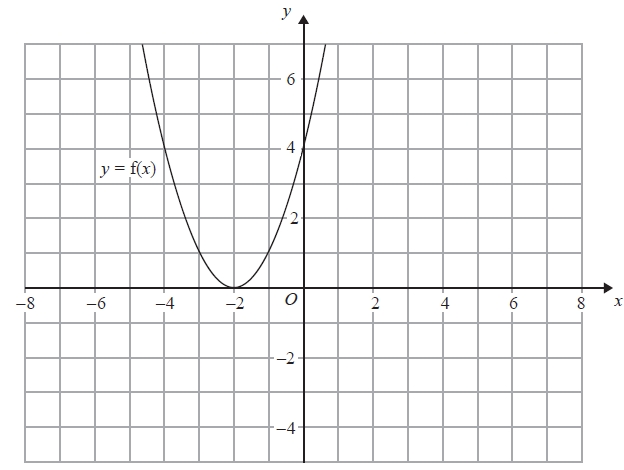
\(y = f(x)\)
The graph of \(y = f(x)\) is shown on the grid.
(a)
On the grid above, sketch the graph of \(y = -f(x)\).
The graph of \(y = f(x)\) is shown on the grid.
The graph G is a translation of the graph of \(y = f(x)\).
(b)
Write down the equation of graph G.
Worked solution
(a)
\(y = -f(x)\) is a reflection of \(y = f(x)\) in the \(x\)-axis, so every point \((x, y)\) on the original curve maps to \((x, -y)\).
The minimum point \((-2, -2)\) maps to the maximum point \((-2, 2)\).
The point \((-4, 2)\) maps to \((-4, -2)\).
The point \((0, 2)\) maps to \((0, -2)\).
Sketch the resulting inverted U-shaped curve through these image points.
Answer: The graph of \(y = -f(x)\) is the original curve reflected in the \(x\)-axis: an inverted U-shape with maximum at \((-2, 2)\), passing through \((-4, -2)\) and \((0, -2)\).
(b)
Compare a key point on \(y = f(x)\) with the corresponding point on graph \(G\). The minimum of \(y = f(x)\) is at \((-2, -2)\), and the minimum of graph \(G\) is at \((4, -2)\).
The \(y\)-coordinate is unchanged and the \(x\)-coordinate has increased by \(4 - (-2) = 6\).
So graph \(G\) is a translation of \(y = f(x)\) by \(6\) units in the positive \(x\)-direction.
A translation of \(a\) units in the \(+x\) direction has equation \(y = f(x - a)\), so here \(a = 6\).
Answer: \(y = f(x - 6)\)
2.2 marks
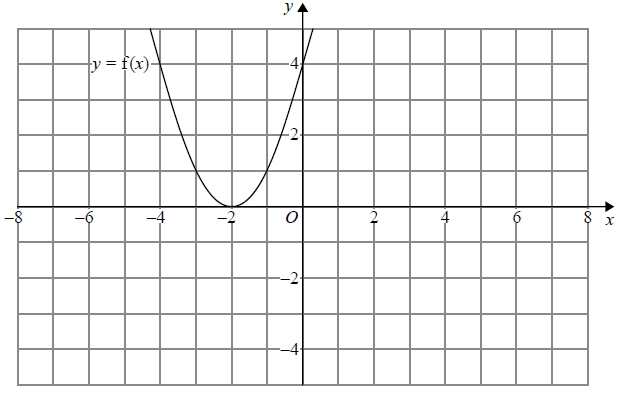
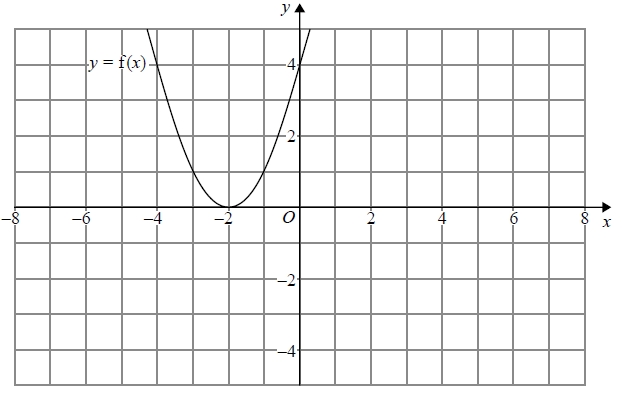
The graph of \(y = f(x)\) is shown on both grids below.
(a)
On the grid above, sketch the graph of \(y = f(-x)\).
(b)
On this grid, sketch the graph of \(y = -f(x) + 3\).
Worked solution
(a)
\(y = f(-x)\) is a reflection of \(y = f(x)\) in the \(y\)-axis, so every point \((x, y)\) maps to \((-x, y)\).
The minimum point \((-2, -2)\) maps to \((2, -2)\).
The point \((-4, 2)\) maps to \((4, 2)\).
The point \((0, 2)\) lies on the \(y\)-axis and maps to itself at \((0, 2)\).
Sketch the U-shaped curve through these image points.
Answer: The graph of \(y = f(-x)\) is the original curve reflected in the \(y\)-axis: a U-shape with minimum at \((2, -2)\), passing through \((0, 2)\) and \((4, 2)\).
(b)
\(y = -f(x) + 3\) applies two transformations to \(y = f(x)\): first reflect in the \(x\)-axis (giving \(-f(x)\)), then translate \(3\) units in the positive \(y\)-direction.
A point \((x, y)\) on the original curve maps to \((x, -y + 3)\).
The minimum \((-2, -2)\) maps to \((-2, -(-2) + 3) = (-2, 5)\); this becomes a maximum.
The point \((-4, 2)\) maps to \((-4, -2 + 3) = (-4, 1)\).
The point \((0, 2)\) maps to \((0, -2 + 3) = (0, 1)\).
Sketch the inverted U-shaped curve through these image points.
Answer: The graph of \(y = -f(x) + 3\) is an inverted U-shape with maximum at \((-2, 5)\), passing through \((-4, 1)\) and \((0, 1)\).
3.4 marks
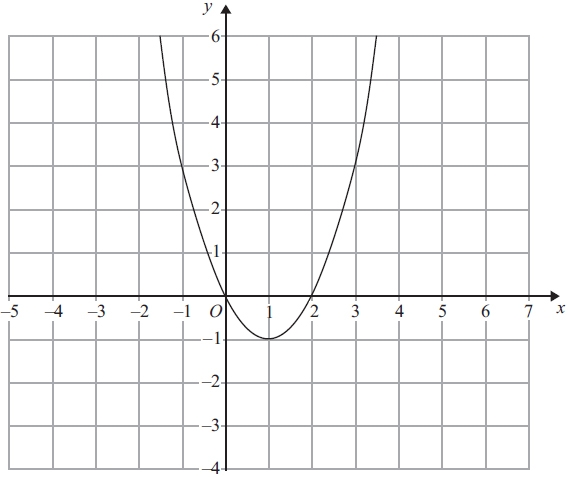
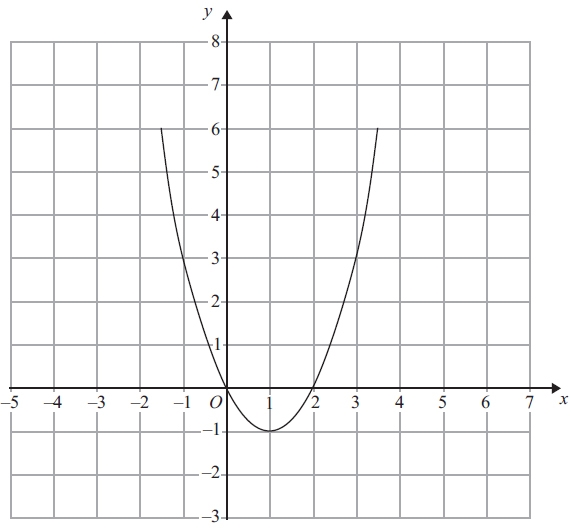
The graph of \(y = f(x)\) is shown on each of the grids.
(a)
On this grid, sketch the graph of \(y = f(x - 3)\).
(b)
On this grid, sketch the graph of \(y = 2f(x)\).
Worked solution
(a)
\(y = f(x - 3)\) is a translation of \(y = f(x)\) by \(3\) units in the positive \(x\)-direction, so every point \((x, y)\) maps to \((x + 3, y)\).
The minimum point \((0, -1)\) maps to \((3, -1)\).
The point \((-2, 3)\) maps to \((1, 3)\).
The point \((2, 3)\) maps to \((5, 3)\).
Sketch the U-shaped curve through these image points.
Answer: The graph of \(y = f(x - 3)\) is the original curve translated \(3\) units to the right: a U-shape with minimum at \((3, -1)\), passing through \((1, 3)\) and \((5, 3)\).
(b)
\(y = 2f(x)\) is a stretch in the \(y\)-direction with scale factor \(2\), so every point \((x, y)\) maps to \((x, 2y)\). The \(x\)-coordinates are unchanged and the \(y\)-coordinates are doubled.
The minimum point \((0, -1)\) maps to \((0, -2)\).
The point \((-2, 3)\) maps to \((-2, 6)\).
The point \((2, 3)\) maps to \((2, 6)\).
Sketch the steeper U-shaped curve through these image points.
Answer: The graph of \(y = 2f(x)\) is the original curve stretched vertically by scale factor \(2\): a U-shape with minimum at \((0, -2)\), passing through \((-2, 6)\) and \((2, 6)\).
4.3 marks
The graph of \(y = f(x)\) is shown on the grid.
(a)
On the grid above, sketch the graph of \(y = f(x + 3)\).
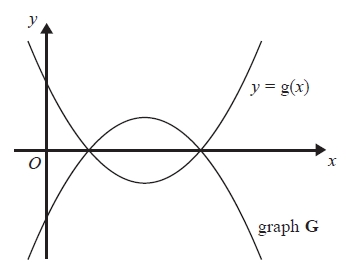
The graph of \(y = g(x)\) is shown below.
The graph G is the reflection of \(y = g(x)\) in the x-axis.
(b)
Write down an equation of graph G.
Worked solution
(a)
\(y = f(x + 3)\) is a translation of \(y = f(x)\) by \(3\) units in the negative \(x\)-direction, so every point \((x, y)\) maps to \((x - 3, y)\).
The minimum point \((-2, -2)\) maps to \((-5, -2)\).
The point \((-4, 2)\) maps to \((-7, 2)\).
The point \((0, 2)\) maps to \((-3, 2)\).
Sketch the U-shaped curve through these image points.
Answer: The graph of \(y = f(x + 3)\) is the original curve translated \(3\) units to the left: a U-shape with minimum at \((-5, -2)\), passing through \((-7, 2)\) and \((-3, 2)\).
(b)
A reflection in the \(x\)-axis sends every point \((x, y)\) to \((x, -y)\).
Applied to \(y = g(x)\), this gives \(y = -g(x)\).
This matches graph \(G\), which is the downward-opening reflection of \(y = g(x)\) across the \(x\)-axis.
Answer: \(y = -g(x)\)
Algebraic Fractions – Simplifying
8 questions
Things to remember
Factorise numerator and denominator
Cancel common factors
Then add/subtract/multiply/divide if necessary
1.3 marks
Simplify
\(\frac{p^2 - 9}{2p + 6}\)
Worked solution
Factorise the numerator using the difference of two squares: \(p^2 - 9 = (p+3)(p-3)\).
Factorise the denominator by taking out the common factor \(2\): \(2p + 6 = 2(p+3)\).
Write the fraction with factorised forms: \(\dfrac{(p+3)(p-3)}{2(p+3)}\).
Cancel the common factor \((p+3)\): \(\dfrac{p-3}{2}\).
Answer: \(\dfrac{p-3}{2}\)
2.3 marks
Simplify fully
\(\frac{6x^2 + 3x}{4x^2 - 1}\)
Worked solution
Factorise the numerator by taking out the common factor \(3x\): \(6x^2 + 3x = 3x(2x+1)\).
Factorise the denominator using the difference of two squares: \(4x^2 - 1 = (2x)^2 - 1^2 = (2x+1)(2x-1)\).
Write the fraction with factorised forms: \(\dfrac{3x(2x+1)}{(2x+1)(2x-1)}\).
Cancel the common factor \((2x+1)\): \(\dfrac{3x}{2x-1}\).
Factorise the denominator: find two numbers that multiply to \(2\) and add to \(3\); these are \(1\) and \(2\), so \(x^2 + 3x + 2 = (x+1)(x+2)\).
Write the fraction with factorised forms: \(\dfrac{(x+1)(x+1)}{(x+1)(x+2)}\).
Cancel the common factor \((x+1)\): \(\dfrac{x+1}{x+2}\).
Answer: \(\dfrac{x+1}{x+2}\)
4.3 marks
Simplify fully
\(\frac{x^2 + x - 6}{x^2 - 7x + 10}\)
Worked solution
Factorise the numerator: find two numbers that multiply to \(-6\) and add to \(1\); these are \(3\) and \(-2\), so \(x^2 + x - 6 = (x+3)(x-2)\).
Factorise the denominator: find two numbers that multiply to \(10\) and add to \(-7\); these are \(-5\) and \(-2\), so \(x^2 - 7x + 10 = (x-5)(x-2)\).
Write the fraction with factorised forms: \(\dfrac{(x+3)(x-2)}{(x-5)(x-2)}\).
Cancel the common factor \((x-2)\): \(\dfrac{x+3}{x-5}\).
Answer: \(\dfrac{x+3}{x-5}\)
5.3 marks
Simplify fully
\(\frac{x^2 - 8x + 15}{2x^2 - 7x - 15}\)
Worked solution
Factorise the numerator: find two numbers that multiply to \(15\) and add to \(-8\); these are \(-3\) and \(-5\), so \(x^2 - 8x + 15 = (x-3)(x-5)\).
Factorise the denominator: find two numbers that multiply to \(2 \times (-15) = -30\) and add to \(-7\); these are \(-10\) and \(3\). Rewrite: \(2x^2 - 10x + 3x - 15 = 2x(x-5) + 3(x-5) = (2x+3)(x-5)\).
Write the fraction with factorised forms: \(\dfrac{(x-3)(x-5)}{(2x+3)(x-5)}\).
Cancel the common factor \((x-5)\): \(\dfrac{x-3}{2x+3}\).
Answer: \(\dfrac{x-3}{2x+3}\)
6.3 marks
Simplify fully
\(\frac{2x^2 + 3x + 1}{x^2 - 3x - 4}\)
Worked solution
Factorise the numerator: find two numbers that multiply to \(2 \times 1 = 2\) and add to \(3\); these are \(2\) and \(1\). Rewrite: \(2x^2 + 2x + x + 1 = 2x(x+1) + 1(x+1) = (2x+1)(x+1)\).
Factorise the denominator: find two numbers that multiply to \(-4\) and add to \(-3\); these are \(-4\) and \(1\), so \(x^2 - 3x - 4 = (x-4)(x+1)\).
Write the fraction with factorised forms: \(\dfrac{(2x+1)(x+1)}{(x-4)(x+1)}\).
Cancel the common factor \((x+1)\): \(\dfrac{2x+1}{x-4}\).
Answer: \(\dfrac{2x+1}{x-4}\)
7.6 marks(a)
Simplify
\(\frac{2x + 4}{x^2 + 4x + 4}\)
(b)
Write
\(\frac{1}{x + 4} + \frac{2}{x - 4}\)
as a single fraction in its simplest form.
Worked solution
(a)
Factorise the numerator by taking out the common factor \(2\): \(2x + 4 = 2(x+2)\).
Factorise the denominator as a perfect square: \(x^2 + 4x + 4 = (x+2)(x+2) = (x+2)^2\).
Write the fraction with factorised forms: \(\dfrac{2(x+2)}{(x+2)^2}\).
Cancel the common factor \((x+2)\): \(\dfrac{2}{x+2}\).
Answer: \(\dfrac{2}{x+2}\)
(b)
The common denominator of \((x+4)\) and \((x-4)\) is \((x+4)(x-4)\).
Rewrite the first fraction: \(\dfrac{1}{x+4} = \dfrac{1 \times (x-4)}{(x+4)(x-4)} = \dfrac{x-4}{(x+4)(x-4)}\).
Rewrite the second fraction: \(\dfrac{2}{x-4} = \dfrac{2 \times (x+4)}{(x+4)(x-4)} = \dfrac{2(x+4)}{(x+4)(x-4)}\).
Add the fractions: \(\dfrac{x-4 + 2(x+4)}{(x+4)(x-4)}\).
Answer: \(y = \dfrac{5}{2}\) or \(y = -\dfrac{1}{2}\)
Solving Quadratic Inequalities
6 questions
Things to remember
Start by solving the quadratic to find x, then sketch the graph to determine the inequality.
1.3 marks
Solve \(x^2 > 3x + 4\)
Worked solution
Rearrange to get 0 on one side: \(x^2 - 3x - 4 > 0\).
Factorise the corresponding quadratic: \(x^2 - 3x - 4 = (x - 4)(x + 1)\), so the roots are \(x = -1\) and \(x = 4\).
The parabola \(y = x^2 - 3x - 4\) opens upward (coefficient of \(x^2\) is positive) and crosses the \(x\)-axis at \(-1\) and \(4\). It lies above the \(x\)-axis (i.e. \(y > 0\)) outside the roots.
Factorise: \(x^2 - x - 12 = (x - 4)(x + 3)\), so the roots are \(x = -3\) and \(x = 4\).
The parabola \(y = x^2 - x - 12\) opens upward and crosses the \(x\)-axis at \(-3\) and \(4\), so \(y \ge 0\) outside the roots (inclusive, because the inequality is non-strict).
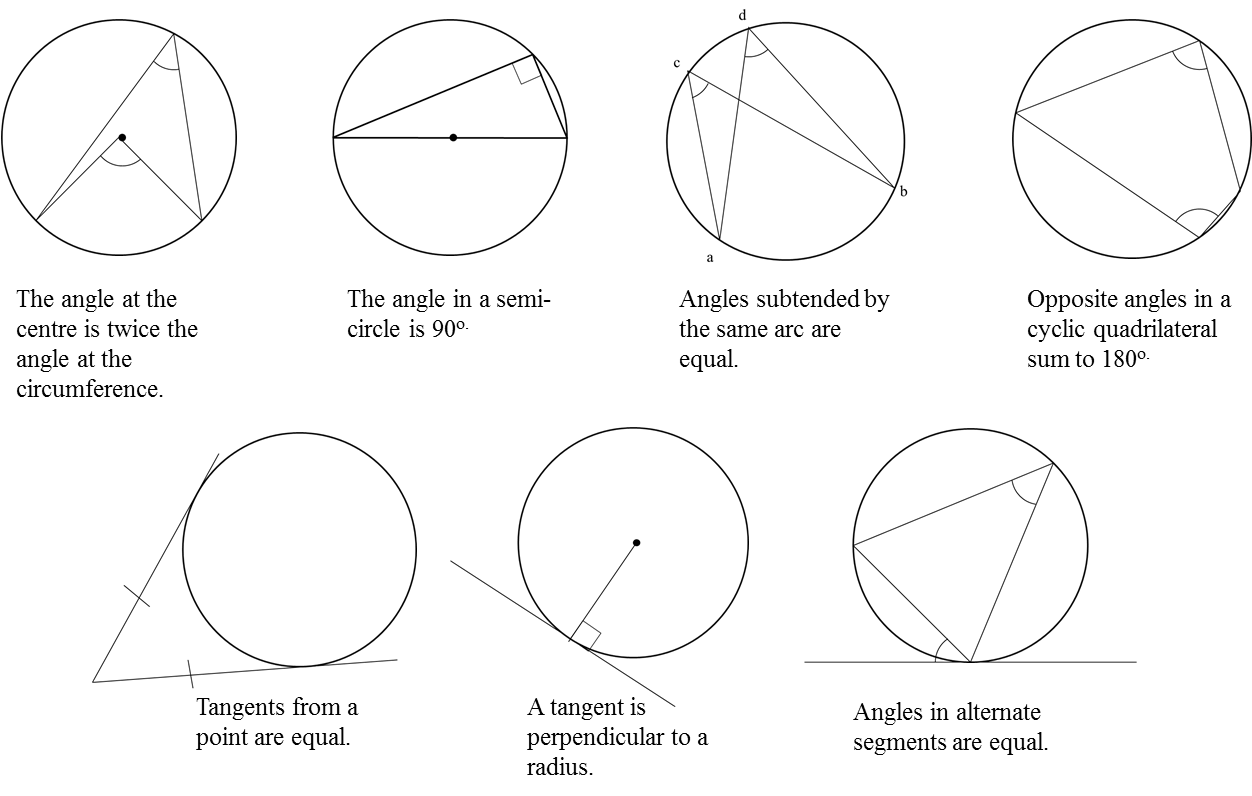
The angle at the centre is twice the angle at the circumference.
The angle in a semi-circle is 90^\circ.
Angles subtended by the same arc are equal.
Opposite angles in a cyclic quadrilateral sum to 180^\circ.
Tangents from a point are equal.
A tangent is perpendicular to a radius.
Angles in alternate segments are equal.
1.[Diagram: Circle with centre O. Point P lies on the circumference. A straight line PQ extends from P outside the circle to point Q, and PQ is a tangent to the circle at P. The radius OP is drawn. Diagram NOT accurately drawn.]
P is a point on the circumference of the circle, centre O.
PQ is a tangent to the circle.
Worked solution
(i)
OP is a radius of the circle and PQ is a tangent to the circle at P.
By the theorem: a tangent to a circle is perpendicular to the radius at the point of tangency.
Therefore angle OPQ = 90°.
Answer: 90°
(ii)
A tangent to a circle is perpendicular to the radius at the point of contact.
Answer: A tangent to a circle is perpendicular to the radius at the point of contact.
2.
Worked solution
(a)(i)
AC is a diameter of the circle and B is a point on the circumference.
By the theorem: the angle in a semicircle is 90°.
Therefore angle ABC = 90°.
Answer: 90°
(a)(ii)
The angle subtended by a diameter at the circumference is always 90° (angle in a semicircle).
Answer: The angle in a semicircle is 90°.
(b)(i)
Angle DOF = 130° is the angle at the centre O, subtended by arc DF.
Angle DEF is the angle at the circumference, subtended by the same arc DF.
By the theorem: the angle at the centre is twice the angle at the circumference.
Therefore angle DEF = 130° ÷ 2 = 65°.
Answer: 65°
(b)(ii)
The angle at the centre is twice the angle at the circumference when both are subtended by the same arc.
Answer: The angle at the centre is twice the angle at the circumference.
3.[Diagram: Circle with centre O. Points A and B lie on the circumference. PA and PB are two tangents drawn from an external point P to the circle, touching at A and B respectively. Angle APB = 86^\circ is marked at P. The angle x is marked at the centre O (angle AOB). Lines OA and OB (radii) are drawn. Diagram NOT accurately drawn.]
A and B are points on the circumference of a circle, centre O.
PA and PB are tangents to the circle.
Angle APB is 86^\circ.
Work out the size of the angle marked x.
Worked solution
PA and PB are tangents to the circle from external point P, touching at A and B respectively.
By the theorem: a tangent is perpendicular to the radius at the point of contact.
Therefore angle OAP = 90° and angle OBP = 90°.
OAPB is a quadrilateral, so the sum of its interior angles is 360°.
By the angle sum of a quadrilateral: x + 90° + 86° + 90° = 360°.
x + 266° = 360°.
x = 360° − 266° = 94°.
Answer: x = 94°
4.[Diagram: Circle with centre O. Points A, B, C and D lie on the circumference forming a cyclic quadrilateral ABCD. Angle BAD = 70^\circ is marked at vertex A. Angle BCD = x^\circ is marked at vertex C. Angle BCD = y^\circ. Diagram NOT accurately drawn.]
In the diagram, A, B, C and D are points on the circumference of a circle, centre O.
Angle BAD = 70^\circ.
Angle BCD = x^\circ.
Angle BCD = y^\circ.
Worked solution
(a)(i)
A, B, C and D are points on the circumference and O is the centre of the circle.
Angle BAD = 70° is an inscribed angle subtending arc BCD.
Angle BOD (= x°) is the central angle subtending the same arc BCD.
By the theorem: the angle at the centre is twice the angle at the circumference.
Therefore x = 2 × 70° = 140°.
Answer: x = 140°
(a)(ii)
The angle at the centre is twice the angle at the circumference when both are subtended by the same arc.
Answer: The angle at the centre is twice the angle at the circumference.
(b)(i)
ABCD is a cyclic quadrilateral (all four vertices lie on the circumference).
By the theorem: opposite angles in a cyclic quadrilateral sum to 180°.
Angle BAD + angle BCD = 180°.
70° + y = 180°.
y = 180° − 70° = 110°.
Answer: y = 110°
(b)(ii)
Opposite angles in a cyclic quadrilateral sum to 180°.
Answer: Opposite angles in a cyclic quadrilateral sum to 180°.
5.[Diagram: Circle with centre O. Points A, B and C lie on the circumference. DCO is a straight line extending through C and O to point D outside the circle on the right. DA is a tangent to the circle at A. Angle ADO = 36^\circ is marked at D. Diagram NOT accurately drawn.]
The diagram shows a circle centre O.
A, B and C are points on the circumference.
DCO is a straight line.
DA is a tangent to the circle.
Angle ADO = 36^\circ.
Worked solution
(a)
DA is a tangent to the circle at A, and OA is a radius.
By the theorem: a tangent is perpendicular to the radius at the point of contact.
Therefore angle OAD = 90°.
In triangle OAD, the angles sum to 180°.
Angle AOD = 180° − 90° − 36° = 54°.
Answer: Angle AOD = 54°
(b)(i)
DCO is a straight line, so from centre O the direction to C is the same as the direction to D.
Therefore angle AOC = angle AOD = 54°.
Angle AOC is the angle at the centre subtending arc AC (the minor arc).
B lies on the major arc from A to C.
By the theorem: the angle at the centre is twice the angle at the circumference (both subtending the same arc).
Therefore angle ABC = 54° ÷ 2 = 27°.
Answer: Angle ABC = 27°
(b)(ii)
The angle at the centre is twice the angle at the circumference when both are subtended by the same arc.
Answer: The angle at the centre is twice the angle at the circumference.
Vectors
8 questions
Things to remember
Use the letter provided in the question.
Going against the arrow is a negative.
Vectors need to be written in bold or underlined.
They can be manipulated similarly to algebra.
1.7 marks
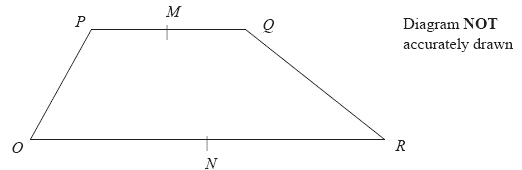
The diagram shows a regular hexagon ABCDEF with centre O.
In a regular hexagon ABCDEF with centre O, opposite vertices are diametrically opposite: \(\overrightarrow{OD} = -6\mathbf{a}\), \(\overrightarrow{OE} = -6\mathbf{b}\), and \(\overrightarrow{OF} = 6\mathbf{a} - 6\mathbf{b}\).
State the route: \(\overrightarrow{EF} = \overrightarrow{EO} + \overrightarrow{OF} = 6\mathbf{b} + (6\mathbf{a} - 6\mathbf{b})\).
Simplify: \(\overrightarrow{EF} = 6\mathbf{a}\).
Answer: \(6\mathbf{a}\)
(b)
From (a)(ii), \(\overrightarrow{OC} = 6\mathbf{b} - 6\mathbf{a}\) and \(\overrightarrow{OE} = -6\mathbf{b}\).
Y is on AB extended such that AB : BY = 3 : 2. Since \(\overrightarrow{AB} = 6\mathbf{b} - 6\mathbf{a}\), we have \(|AB|\) corresponds to the vector \(6\mathbf{b} - 6\mathbf{a}\).
Since \(\overrightarrow{EY}\) is a scalar multiple of \(\overrightarrow{EX}\), and both vectors share the point E, the points E, X and Y are collinear.
2.3 marks
T is the point on PQ for which PT : TQ = 2 : 1.
OPQ is a triangle.
\(\overrightarrow{OP} = \mathbf{a}\) and \(\overrightarrow{OQ} = \mathbf{b}\).
(a)
Write down, in terms of a and b, an expression for \(\overrightarrow{PQ}\).
(b)
Express \(\overrightarrow{OT}\) in terms of a and b. Give your answer in its simplest form.
Worked solution
(a)
State the route: \(\overrightarrow{PQ} = \overrightarrow{PO} + \overrightarrow{OQ}\).
M is the midpoint of CB. \(\overrightarrow{CB} = \overrightarrow{OA} = 6\mathbf{a}\) (opposite sides of a parallelogram). So \(\overrightarrow{CM} = \tfrac{1}{2}\overrightarrow{CB} = 3\mathbf{a}\).
Since \(\overrightarrow{OM}\) is a scalar multiple (\(\tfrac{3}{2}\)) of \(\overrightarrow{OP}\), and both vectors start from O, the points O, P and M lie on the same straight line.
4.5 marks
OPQ is a triangle.
R is the midpoint of OP.
S is the midpoint of PQ.
\(\overrightarrow{OP} = \mathbf{p}\) and \(\overrightarrow{OQ} = \mathbf{q}\)
(i)
Find \(\overrightarrow{OS}\) in terms of p and q.
(ii)
Show that RS is parallel to OQ.
Worked solution
(i)
State the route: \(\overrightarrow{OS} = \overrightarrow{OP} + \overrightarrow{PS}\).
S is the midpoint of PQ, so \(\overrightarrow{PS} = \tfrac{1}{2}\overrightarrow{PQ}\).
Since \(\overrightarrow{RS} = \tfrac{1}{2}\mathbf{q}\) and \(\overrightarrow{OQ} = \mathbf{q}\), \(\overrightarrow{RS}\) is a scalar multiple (\(\tfrac{1}{2}\)) of \(\overrightarrow{OQ}\).
X is the midpoint of MN, so \(\overrightarrow{MX} = \tfrac{1}{2}\overrightarrow{MN} = \tfrac{1}{2}(2\mathbf{a} - 2\mathbf{b}) = \mathbf{a} - \mathbf{b}\).
Find the position of Q relative to O: \(\overrightarrow{OQ} = \overrightarrow{OP} + \overrightarrow{PQ} = 2\mathbf{b} + 2\mathbf{a}\).
Find \(\overrightarrow{OR} = 6\mathbf{a}\), so Y is the midpoint of QR: \(\overrightarrow{QY} = \tfrac{1}{2}\overrightarrow{QR}\).
Since \(\overrightarrow{XY} = 2\mathbf{a}\) and \(\overrightarrow{OR} = 6\mathbf{a}\), \(\overrightarrow{XY}\) is a scalar multiple (\(\tfrac{1}{3}\)) of \(\overrightarrow{OR}\).
Therefore XY is parallel to OR.
6.3 marks
ABCD is a straight line.
O is a point so that \(\overrightarrow{OA} = \mathbf{a}\) and \(\overrightarrow{OB} = \mathbf{b}\).
B is the midpoint of AC.
C is the midpoint of AD.
Express, in terms of a and b, the vectors
(i)
\(\overrightarrow{AC}\)
(ii)
\(\overrightarrow{OD}\)
Worked solution
(i)
B is the midpoint of AC, so \(\overrightarrow{AC} = 2\overrightarrow{AB}\).
State the route: \(\overrightarrow{AB} = \overrightarrow{AO} + \overrightarrow{OB} = -\mathbf{a} + \mathbf{b}\).
Since \(\overrightarrow{PR}\) is a scalar multiple (4) of \(\overrightarrow{PQ}\), and both vectors share the starting point P, the points P, Q and R lie on the same straight line.
(c)
Since \(\overrightarrow{PR} = 4\,\overrightarrow{PQ}\), the length \(PR = 4 \times PQ\).
Given PQ = 3 cm, so \(PR = 4 \times 3 = 12\) cm.
Answer: 12 cm
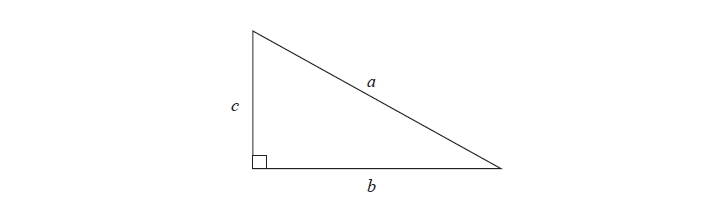
Sine and Cosine Rules
8 questions
Things to remember
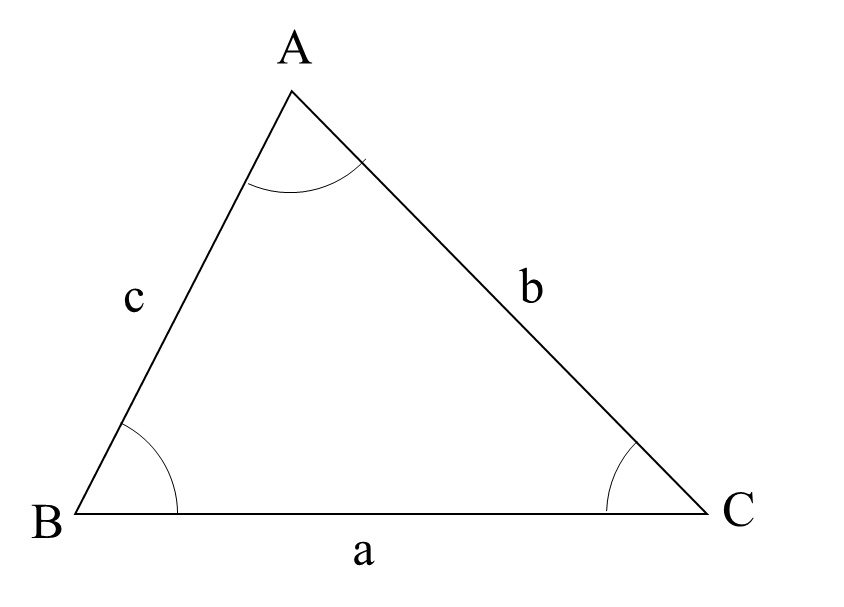
a² = b² + c² - 2bc cosA
a/sinA = b/sinB = c/sinC
Area = ½ ab sinC
Labelled triangle ABC with sides a, b, c opposite their respective angles A, B, C.
1.5 marks
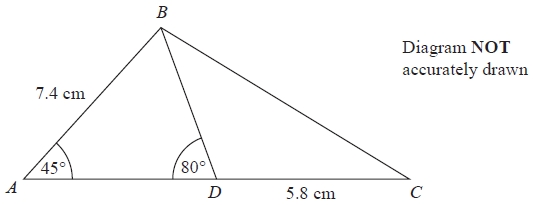
Diagram NOT accurately drawn
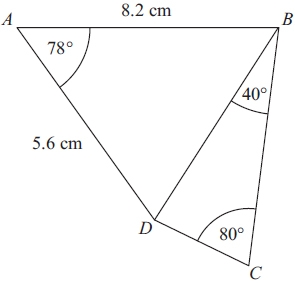
ABC is a triangle.
D is a point on AC.
Angle BAD = 45°
Angle ADB = 80°
AB = 7.4 cm
DC = 5.8 cm
Work out the length of BC.
Give your answer correct to 3 significant figures.
............... cm
Worked solution
Use the sine rule in triangle ABD because we know two angles and one side (AB = 7.4 cm). First find the third angle: \(\angle ABD = 180^\circ - 45^\circ - 80^\circ = 55^\circ\).
Sine rule: \(\dfrac{BD}{\sin(\angle BAD)} = \dfrac{AB}{\sin(\angle ADB)}\).
\(\dfrac{BD}{\sin 45^\circ} = \dfrac{7.4}{\sin 80^\circ}\), so \(BD = \dfrac{7.4 \sin 45^\circ}{\sin 80^\circ} = \dfrac{7.4 \times 0.70711}{0.98481} = 5.3130\) cm.
In triangle BDC, angle BDC is the supplement of angle ADB (since A, D, C are collinear): \(\angle BDC = 180^\circ - 80^\circ = 100^\circ\).
Now use the cosine rule in triangle BDC because we know two sides (BD = 5.313, DC = 5.8) and the included angle (100°): \(BC^2 = BD^2 + DC^2 - 2 \cdot BD \cdot DC \cdot \cos(\angle BDC)\).
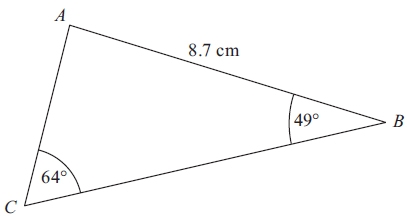
Give your answer correct to 3 significant figures.
............... cm²
Worked solution
We know two angles and one side (AB = 8.7 cm). To use the area formula we need two sides and an included angle, so first find the third angle: \(\angle BAC = 180^\circ - 49^\circ - 64^\circ = 67^\circ\).
Use the sine rule to find AC (we know angle-side-angle): \(\dfrac{AC}{\sin(\angle ABC)} = \dfrac{AB}{\sin(\angle ACB)}\).
Give your answer correct to 3 significant figures.
............... cm
Worked solution
Split the quadrilateral with diagonal BD. In triangle ABD we know two sides (AB = 8.2, AD = 5.6) and the included angle (angle DAB = 76°), so use the cosine rule.
\(BD^2 = AB^2 + AD^2 - 2 \cdot AB \cdot AD \cdot \cos(\angle DAB)\).
Give your answer correct to 3 significant figures.
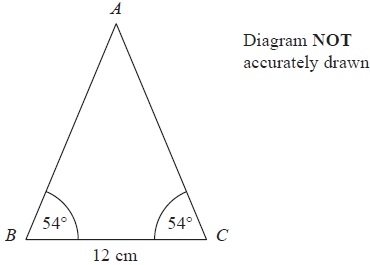
............... cm²
Worked solution
The base angles are both 54°, so the apex angle is \(\angle BAC = 180^\circ - 54^\circ - 54^\circ = 72^\circ\).
Use the sine rule to find the equal sides AB = AC (we know one side BC = 12 and all angles): \(\dfrac{AB}{\sin(\angle ACB)} = \dfrac{BC}{\sin(\angle BAC)}\).
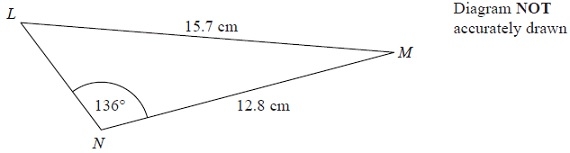
Give your answer correct to 3 significant figures.
............... cm
Worked solution
We know two sides (LM = 15.7, MN = 12.8) and a non-included angle (angle LNM = 130°). Use the sine rule to find angle MLN because the known angle is opposite the longer known side.
\(\sin(\angle MLN) = \dfrac{12.8 \sin 130^\circ}{15.7} = \dfrac{12.8 \times 0.76604}{15.7} = 0.62458\), so \(\angle MLN = 38.648^\circ\) (the obtuse alternative is impossible because the triangle already contains 130°).
The third angle is \(\angle LMN = 180^\circ - 130^\circ - 38.648^\circ = 11.352^\circ\).
Apply the sine rule for LN: \(\dfrac{LN}{\sin(\angle LMN)} = \dfrac{LM}{\sin(\angle LNM)}\).
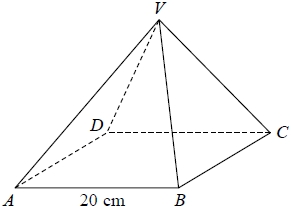
The angle between any sloping edge and the plane ABCD is 55°
Calculate the surface area of the pyramid.
Give your answer correct to 2 significant figures.
............... cm²
Worked solution
Place the centre of the square base at O. The diagonal of the square has length \(20\sqrt{2}\) cm, so each base vertex is at distance \(OA = 10\sqrt{2} \approx 14.142\) cm from O.
Each sloping edge VA makes 55° with the base, so in right-angled triangle VOA: \(\cos 55^\circ = \dfrac{OA}{VA}\), giving \(VA = \dfrac{10\sqrt{2}}{\cos 55^\circ} = \dfrac{14.142}{0.57358} = 24.656\) cm.
The vertical height of the pyramid is \(h = VO = 10\sqrt{2} \tan 55^\circ = 14.142 \times 1.42815 = 20.196\) cm.
Each triangular face has a base of 20 cm. Its slant height l (from V to the midpoint M of a base edge) uses OM = 10: \(l = \sqrt{h^2 + 10^2} = \sqrt{20.196^2 + 100} = \sqrt{407.87 + 100} = \sqrt{507.87} = 22.536\) cm.
Area of one triangular face \(= \dfrac{1}{2} \times 20 \times 22.536 = 225.36\) cm\(^2\). Four faces give \(4 \times 225.36 = 901.45\) cm\(^2\).
Area of the square base \(= 20^2 = 400\) cm\(^2\).
Total surface area \(= 901.45 + 400 = 1301.45\) cm\(^2\).
Answer: Surface area \(\approx 1300\) cm\(^2\) (2 s.f.)
7.7 marks
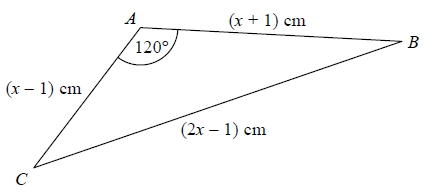
The diagram shows triangle ABC.
The area of triangle ABC is \(k\sqrt{3}\) cm².
Find the exact value of \(k\).
\(k = \) ...............
Worked solution
Two sides AB = (x+1) and AC = (x-1) meet at angle BAC = 120°; the opposite side is BC = (2x-1). Use the cosine rule because we have two sides and an included angle expressed in terms of x.
\(BC^2 = AB^2 + AC^2 - 2 \cdot AB \cdot AC \cdot \cos(\angle BAC)\).
\(x^2 - 4x = 0 \Rightarrow x(x-4) = 0\). Since lengths must be positive (\(x-1>0\)), \(x = 4\).
Then AB = 5, AC = 3, and \(\sin 120^\circ = \dfrac{\sqrt{3}}{2}\).
Use the area formula: \(\text{Area} = \dfrac{1}{2} \cdot AB \cdot AC \cdot \sin(\angle BAC) = \dfrac{1}{2} \times 5 \times 3 \times \dfrac{\sqrt{3}}{2} = \dfrac{15\sqrt{3}}{4}\) cm\(^2\).
Comparing with \(k\sqrt{3}\): \(k = \dfrac{15}{4}\).
Answer: \(k = \dfrac{15}{4}\)
8.5 marks
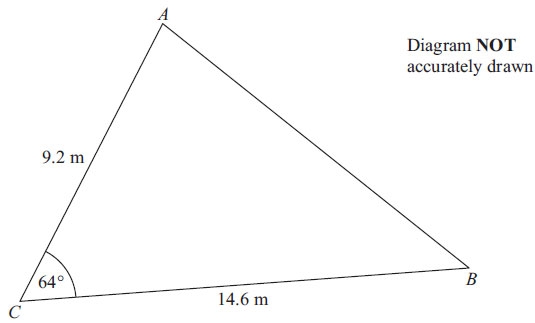
Diagram NOT accurately drawn
AC = 9.2 m
BC = 14.6 m
Angle ACB = 64°
(a)
Calculate the area of the triangle ABC.
Give your answer correct to 3 significant figures.
............... m²
(b)
Calculate the length of AB.
Give your answer correct to 3 significant figures.
Worked solution
(a)
We know two sides (AC = 9.2, BC = 14.6) and the included angle (angle ACB = 64°), so use the area formula directly.
\(\text{Area} = \dfrac{1}{2} \cdot AC \cdot BC \cdot \sin(\angle ACB)\).
Plot each cumulative frequency at the upper class boundary: \((175,\ 5)\), \((180,\ 23)\), \((185,\ 35)\), \((190,\ 39)\), \((195,\ 40)\).
Join the points with a smooth curve (or straight line segments).
Answer: A cumulative frequency curve plotted through \((175,\ 5)\), \((180,\ 23)\), \((185,\ 35)\), \((190,\ 39)\), \((195,\ 40)\).
2.9 marks
The table gives information about the ages of 160 employees of an IT company.
Age (A) in years
Frequency
Cumulative Frequency
\(15 < A \leq 25\)
44
\(25 < A \leq 35\)
56
\(35 < A \leq 45\)
34
\(45 < A \leq 55\)
19
\(55 < A \leq 65\)
7
(a)
Write down the modal class interval.
(b)
Complete the cumulative frequency table.
(c)
On the grid below, draw a cumulative frequency graph for your table.
(d)
Use your graph to find an estimate for
(i)
the median age of the employees.
(ii)
the interquartile range of the ages of the employees.
Another IT company has 80 employees. The age of the youngest employee is 24 years. The age of the oldest employee is 54 years. The median age is 38 years. The lower quartile age is 30 years. The upper quartile age is 44 years.
(e)
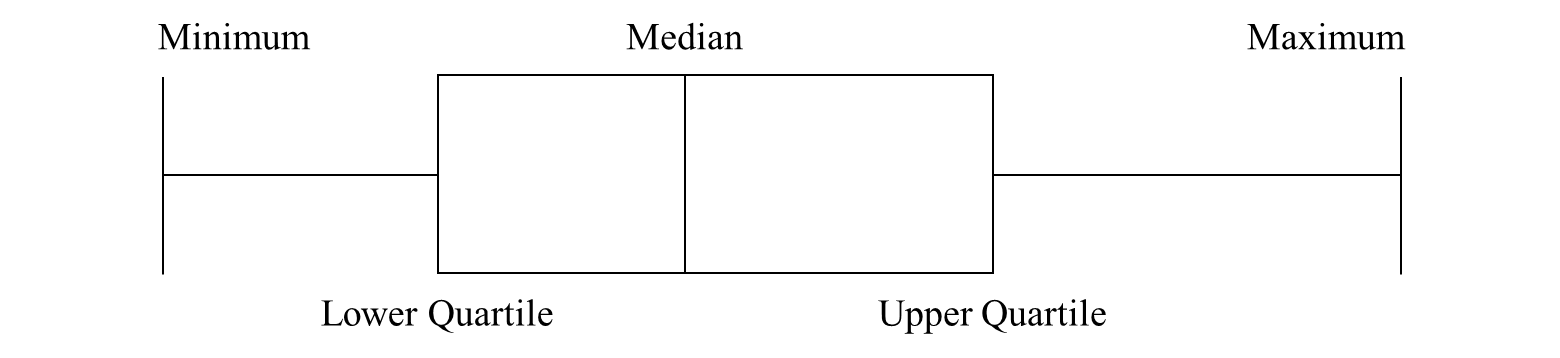
On the grid below, draw a box plot to show information about the ages of the employees.
Worked solution
(a)
The modal class interval is the class with the highest frequency.
The highest frequency is \(56\), which corresponds to \(25 < A \leq 35\).
Answer: \(25 < A \leq 35\)
(b)
Use a running total to complete the cumulative frequency column.
Plot each cumulative frequency at the upper class boundary: \((10,\ 16)\), \((20,\ 50)\), \((30,\ 82)\), \((40,\ 96)\), \((50,\ 100)\).
Join the points with a smooth curve.
Answer: A cumulative frequency curve plotted through \((10,\ 16)\), \((20,\ 50)\), \((30,\ 82)\), \((40,\ 96)\), \((50,\ 100)\).
(c)
Read from the graph at \(t = 18\) seconds: CF \(\approx 42\).
The number of calls taking more than \(18\) seconds \(= 100 - 42 = 58\).
Answer: Approximately \(58\) calls.
6.3 marks
200 students took a test. The cumulative frequency graph gives information about their marks.
The lowest mark scored in the test was 10. The highest mark scored in the test was 60.
Use this information and the cumulative frequency graph to draw a box plot showing information about the students' marks.
Worked solution
There are \(200\) students, so median at \(n/2 = 100\), LQ at \(n/4 = 50\), UQ at \(3n/4 = 150\).
From the cumulative frequency graph, read across at CF \(= 50\): LQ \(\approx 25\).
Read across at CF \(= 100\): median \(\approx 33\).
Read across at CF \(= 150\): UQ \(\approx 42\).
Minimum mark \(= 10\), maximum mark \(= 60\) (given).
Draw a box from \(25\) to \(42\), with a vertical line at \(33\) for the median. Draw whiskers from \(10\) to \(25\) and from \(42\) to \(60\).
Answer: Box plot with minimum \(= 10\), LQ \(\approx 25\), median \(\approx 33\), UQ \(\approx 42\), maximum \(= 60\).
7.4 marks
On Friday, Peter went to the airport. He recorded the number of minutes that each plane was delayed. He used his results to work out the information in this table.
Minutes
Shortest delay
0
Lower quartile
2
Median
8
Upper quartile
18
Longest delay
41
(a)
On the grid, draw a box plot to show the information in the table.
Peter also went to the airport on Saturday. He recorded the number of minutes that each plane was delayed. The box plot below was drawn using this information.
(b)
Make two comparisons between the distributions of plane delays on Friday and on Saturday.
Worked solution
(a)
Use the five-figure summary from the table: shortest delay \(= 0\), LQ \(= 2\), median \(= 8\), UQ \(= 18\), longest delay \(= 41\).
Draw a box from \(2\) to \(18\) on the minutes axis, with a vertical line at \(8\) for the median.
Draw whiskers from \(0\) to \(2\) and from \(18\) to \(41\).
Answer: Box plot with minimum \(= 0\), LQ \(= 2\), median \(= 8\), UQ \(= 18\), maximum \(= 41\).
(b)
From the Saturday box plot: minimum \(\approx 5\), LQ \(\approx 15\), median \(\approx 22\), UQ \(\approx 30\), maximum \(\approx 50\).
Comparison 1 (median): The median delay on Saturday (\(22\) minutes) is higher than on Friday (\(8\) minutes), so on average planes were delayed longer on Saturday.
Comparison 2 (IQR): The IQR on Saturday (\(15\) minutes) is similar to Friday (\(16\) minutes), so the spread of delays was roughly the same on both days.
Answer: On average, delays were longer on Saturday (median \(22\) vs \(8\) minutes). The spread (IQR) was similar: \(15\) minutes on Saturday vs \(16\) minutes on Friday.
Histograms
7 questions
Things to remember
Frequency = FD × Class Width
y-axis = frequency density
x-axis = continuous scale
1.5 marks
One Monday, Victoria measured the time, in seconds, that individual birds spent on her bird table. She used this information to complete the frequency table.
Time (t seconds)
Frequency
\(0 < t \leq 10\)
8
\(10 < t \leq 20\)
16
\(20 < t \leq 25\)
15
\(25 < t \leq 30\)
12
\(30 < t \leq 50\)
6
(a)
Use the table to complete the histogram.
On Tuesday she conducted a similar survey and drew the following histogram from her results.
(b)
Use the histogram for Tuesday to complete the table.
Time (t seconds)
Frequency
\(0 < t \leq 10\)
10
\(10 < t \leq 20\)
\(20 < t \leq 25\)
\(25 < t \leq 30\)
\(30 < t \leq 50\)
Worked solution
(a)
Compute frequency density (FD) = frequency / class width for each class.
Answer: Draw bars at frequency densities: \(4000 < w \le 6000\) at \(0.008\); \(8000 < w \le 12000\) at \(0.002\).
5.3 marks
The incomplete histogram and table give some information about the distances some teachers travel to school.
(a)
Use the information in the histogram to complete the frequency table.
Distance (d km)
Frequency
\(0 < d \leq 5\)
15
\(5 < d \leq 10\)
20
\(10 < d \leq 20\)
\(20 < d \leq 40\)
\(40 < d \leq 60\)
10
(b)
Use the information in the table to complete the histogram.
Worked solution
(a)
The given \(0 < d \le 5\) bar has frequency \(15\) over width \(5\), so FD \(= 3\); the \(5 < d \le 10\) bar has frequency \(20\) over width \(5\), so FD \(= 4\). Use these to calibrate the y-axis.
\(10 < d \le 20\): read FD \(= 2\), frequency \(= 2 \times 10 = 20\).
\(20 < d \le 40\): read FD \(= 1\), frequency \(= 1 \times 20 = 20\).
Answer: \(10 < d \le 20\): \(20\); \(20 < d \le 40\): \(20\).
(b)
The bar for \(20 < d \le 40\) needs to be drawn from the table.
\(20 < d \le 40\): FD \(= 20 / 20 = 1\).
Draw a bar from \(d = 20\) to \(d = 40\) at frequency density \(1\).
Answer: Draw the bar \(20 < d \le 40\) at frequency density \(1\).
6.3 marks
The table gives information about the heights, in centimetres, of some 15 year old students.
Height (h cm)
\(145 < h \leq 155\)
\(155 < h \leq 175\)
\(175 < h \leq 190\)
Frequency
10
80
24
Use the table to draw a histogram.
Worked solution
Compute frequency density FD \(=\) frequency / class width for each class.
Answer: Draw bars at frequency densities: \(145 < h \le 155\) at \(1\); \(155 < h \le 175\) at \(4\); \(175 < h \le 190\) at \(1.6\).
7.2 marks
A teacher asked some year 10 students how long they spent doing homework each night. The histogram was drawn from this information.
Use the histogram to complete the table.
Time (t minutes)
Frequency
\(10 \leq t < 15\)
10
\(15 \leq t < 30\)
\(30 \leq t < 40\)
\(40 \leq t < 50\)
\(50 \leq t < 70\)
Worked solution
The given \(10 \le t < 15\) bar has frequency \(10\) over width \(5\), so FD \(= 10/5 = 2\). Use this to calibrate the y-axis.
Read each bar's frequency density from the histogram, then use Frequency \(=\) FD \(\times\) class width.
\(15 \le t < 30\): FD \(= 1.6\), frequency \(= 1.6 \times 15 = 24\).
\(30 \le t < 40\): FD \(= 1.5\), frequency \(= 1.5 \times 10 = 15\).
\(40 \le t < 50\): FD \(= 1\), frequency \(= 1 \times 10 = 10\).
\(50 \le t < 70\): FD \(= 1\), frequency \(= 1 \times 20 = 20\).
Answer: \(15 \le t < 30\): \(24\); \(30 \le t < 40\): \(15\); \(40 \le t < 50\): \(10\); \(50 \le t < 70\): \(20\).
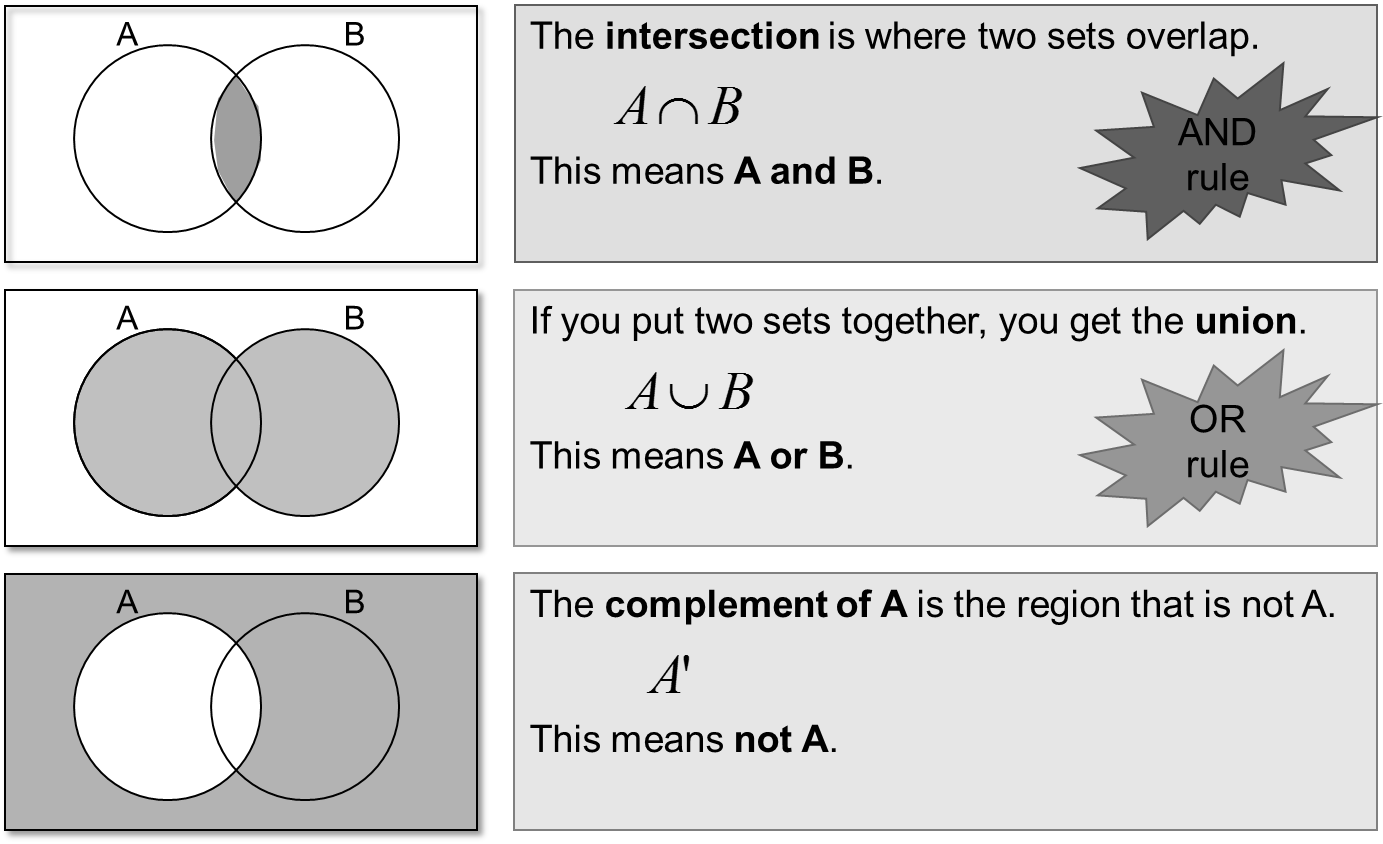
Set Theory
3 questions
Things to remember
Intersection \(A \cap B\) = A and B
Union \(A \cup B\) = A or B
Complement \(A'\) = not A
1.4 marks
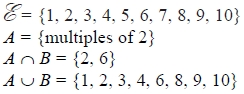
\(\xi = \{1, 2, 3, 4, 5, 6, 7, 8, 9, 10\}\)
\(A = \{\text{multiples of } 2\}\)
\(A \cap B = \{2, 6\}\)
\(A \cup B = \{1, 2, 3, 4, 6, 8, 9, 10\}\)
Draw a Venn diagram for this information.
Worked solution
List the universal set: \(\xi = \{1, 2, 3, 4, 5, 6, 7, 8, 9, 10\}\).
Set A (multiples of 2): \(A = \{2, 4, 6, 8, 10\}\).
The intersection \(A \cap B = \{2, 6\}\), so 2 and 6 are placed in the overlap of A and B.
Find B: every element of B is in \(A \cup B\). The elements of B that are not in A are \((A \cup B) \setminus A = \{1, 3, 9\}\). Combined with the intersection gives \(B = \{1, 2, 3, 6, 9\}\).
Elements in A only (\(A \cap B'\)): \(\{2, 4, 6, 8, 10\} \setminus \{2, 6\} = \{4, 8, 10\}\).
Elements in B only (\(A' \cap B\)): \(\{1, 3, 9\}\).
Elements outside both circles (\((A \cup B)'\)): \(\xi \setminus (A \cup B) = \{5, 7\}\).
Answer: Venn diagram with two overlapping circles A and B inside rectangle \(\xi\). In A only: 4, 8, 10. In the intersection \(A \cap B\): 2, 6. In B only: 1, 3, 9. Outside both circles but inside \(\xi\): 5, 7.
2.4 marks
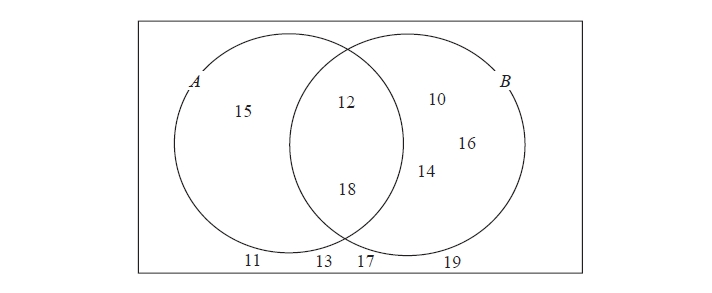
Here is a Venn diagram.
(a)
Write down the numbers that are in set
(i)
\(A \cup B\)
(ii)
\(A \cap B\)
One of the numbers in the diagram is chosen at random.
(b)
Find the probability that the number is in set \(A'\).
Worked solution
(a)(i)
\(A \cup B\) is every element inside either circle: A only, B only, or the intersection.
A only: \(\{4, 15\}\). Intersection \(A \cap B\): \(\{12, 18\}\). B only: \(\{3, 10, 14, 16\}\).
All 50 people like at least one drink, so outside all circles = 0. Sum of known regions: \(19 + 16 + 2 + 5 + 3 + 1 = 46\).
Tea only \(= 50 - 46 = 4\).
Venn diagram regions: Tea only = 4, Coffee only = 3, Milk only = 1, T \(\cap\) C only = 16, T \(\cap\) M only = 5, C \(\cap\) M only = 2, T \(\cap\) C \(\cap\) M = 19, outside = 0.
Number who like tea: \(n(T) = 4 + 16 + 5 + 19 = 44\).
In a factory, chemical reactions are carried out in spherical containers. The time, \(T\) minutes, the chemical reaction takes is directly proportional to the square of the radius, \(R\) cm, of the spherical container.
When \(R = 120\), \(T = 32\)
Find the value of \(T\) when \(R = 150\)
Worked solution
\(T\) is directly proportional to \(R^2\), so write \(T = kR^2\).
The time, \(T\) seconds, it takes a water heater to boil some water is directly proportional to the mass of water, \(m\) kg, in the water heater. When \(m = 250\), \(T = 600\)
(a)
Find \(T\) when \(m = 400\)
The time, \(T\) seconds, it takes a water heater to boil a constant mass of water is inversely proportional to the power, \(P\) watts, of the water heater. When \(P = 1400\), \(T = 360\)
(b)
Find the value of \(T\) when \(P = 900\)
Worked solution
(a)
\(T\) is directly proportional to \(m\), so write \(T = km\).
A ball falls vertically after being dropped. The ball falls a distance \(d\) metres in a time of \(t\) seconds. \(d\) is directly proportional to the square of \(t\). The ball falls 20 metres in a time of 2 seconds.
(a)
Find a formula for \(d\) in terms of \(t\).
(b)
Calculate the distance the ball falls in 3 seconds.
(c)
Calculate the time the ball takes to fall 605 m.
Worked solution
(a)
\(d\) is directly proportional to \(t^2\), so write \(d = kt^2\).
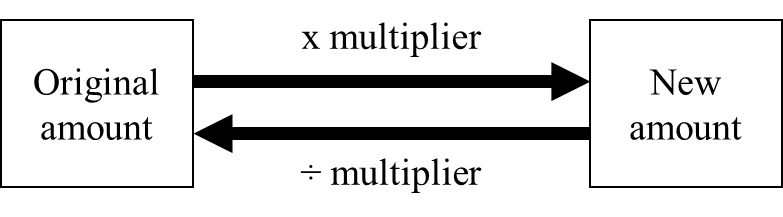
The value of the machine depreciates by 20% each year.
(a)
Bill says 'after 5 years the machine will have no value'.
Bill is wrong. Explain why.
Bill wants to work out the value of the machine after 2 years.
(b)
By what single decimal number should Bill multiply the value of the machine when new?
Worked solution
(a)
Each year the machine is multiplied by \(0.8\) (i.e. it retains 80% of its value).
Multiplying by \(0.8\) five times gives \(0.8^5 = 0.32768\), which is about 33% of the original value, not 0%.
Because each year the depreciation is 20% of the current (smaller) value, not 20% of the original value, the value never reaches zero.
Answer: Each year the machine loses 20% of its current value, not 20% of its original value, so after 5 years it still has about 32.8% of its original value.
(b)
A 20% decrease each year corresponds to a multiplier of \(1 - 0.20 = 0.80\).
After 2 years the combined multiplier is \(0.80 \times 0.80 = 0.80^2 = 0.64\).
Answer: \(0.64\)
3.3 marks
Gwen bought a new car. Each year, the value of her car depreciated by 9%.
Calculate the number of years after which the value of her car was 47% of its value when new.
Worked solution
A 9% depreciation each year gives a multiplier of \(1 - 0.09 = 0.91\).
We need the number of years \(n\) such that \(0.91^n = 0.47\).
Try successive values of \(n\):
\(n=1\): \(0.91^1 = 0.91\).
\(n=2\): \(0.91^2 = 0.8281\).
\(n=3\): \(0.91^3 = 0.753571\).
\(n=4\): \(0.91^4 = 0.685750\).
\(n=5\): \(0.91^5 = 0.623832\).
\(n=6\): \(0.91^6 = 0.567687\).
\(n=7\): \(0.91^7 = 0.516595\).
\(n=8\): \(0.91^8 = 0.470102 \approx 0.47\). ✓
Answer: \(8\) years
4.3 marks
The value of a car depreciates by 35% each year.
At the end of 2007 the value of the car was £5460.
Work out the value of the car at the end of 2006.
Worked solution
A 35% depreciation per year gives a multiplier of \(1 - 0.35 = 0.65\).
Let \(V\) be the value at the end of 2006. Then \(V \times 0.65 = 5460\).
Divide both sides by \(0.65\): \(V = \dfrac{5460}{0.65} = 8400\).
Answer: £8400.00
5.5 marks
Toby invested £4500 for 2 years in a savings account.
He was paid 4% per annum compound interest.
(a)
How much did Toby have in his savings account after 2 years?
Jasper invested £2400 for \(n\) years in a savings account.
He was paid 7.5% per annum compound interest.
At the end of the \(n\) years he had £3445.51 in the savings account.
(b)
Work out the value of \(n\).
Worked solution
(a)
The compound interest multiplier is \(1 + 0.04 = 1.04\).
Bill says 'This means Hajra's weekly pay last year was £192'.
Bill is wrong.
(a)
Explain why.
(b)
Work out Hajra's weekly pay last year.
Worked solution
(a)
<p>Bill has calculated \(20\%\) of this year's pay (£240) and subtracted it: \(240 - 0.20 \times 240 = 192\).</p>
<p>This is wrong because the \(20\%\) increase was applied to last year's pay, not to this year's pay. So you must divide by the multiplier \(1.20\), not take \(20\%\) off £240.</p>
Answer: Bill took 20% off this year’s pay, but the 20% increase was applied to last year’s pay, so he should divide £240 by 1.20 instead.
(b)
<p>A \(20\%\) increase gives a multiplier of \(1 + 0.20 = 1.20\).</p>
<p>Let last year's weekly pay be \(L\). Then \(L \times 1.20 = 240\).</p>